

February Market Commentary
March 5, 2021
February built moderately upon the global equity market gains posted in January. The month opened with a series of new all-time highs for US benchmarks, peaking around mid-month. An unusual characteristic during this half of the month was the surprising diminishment of net daily gains/losses. Prices frequently opened sharply higher or lower only to retrace the balance of the session, ending with nominal gains or losses.
Beyond the mid-point however, volatility returned, and most markets were on balance lower into the month’s final trading sessions, led by weakness in the NASDAQ Comp. By the beginning of March, stocks had lost about 50% of the month’s gains, but remained net positive. February and YTD performance of key global benchmarks is illustrated below.
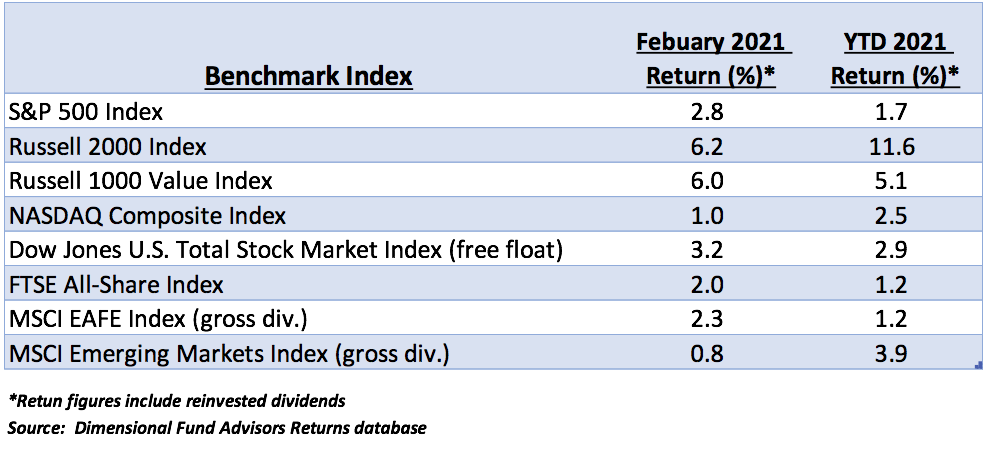
Small cap and value equities continue to outperform large cap and growth. The Russell 2000 and 1000 Value indexes convincingly outstripped large cap indexes such as the S&P 500 in February. The Russell 2000 Value index (not shown), which tracks US small cap value stocks, gained 9.4% last month and is up 15.5% YTD.
S&P 500 and Comp daily price swings have been strongly influenced by a handful of high-priced tech companies. This anomaly is not likely to disappear in the foreseeable future given the roughly 25% of total market value of the Comp currently represented by the FAANG cadre.[1]
The global economy is rebounding and could reattain pre-pandemic output levels by year end, if not sooner.[2] Commodity and raw materials prices are significantly higher since last year’s spring trough, although recent strong gains by some key metals, such as copper, have been partly driven by speculation. Nevertheless, the US and other major economies are in strong recoveries, well ahead of the pace expected last fall.
In the US, 10% annualized first quarter GDP expansion is currently projected. Blue Chip consensus estimates are lower, but not yet comparably updated. Data compiled by the Atlanta Fed’s GDP Now tool has had a strong record. The latest report, as of March 1, 2021, is below.
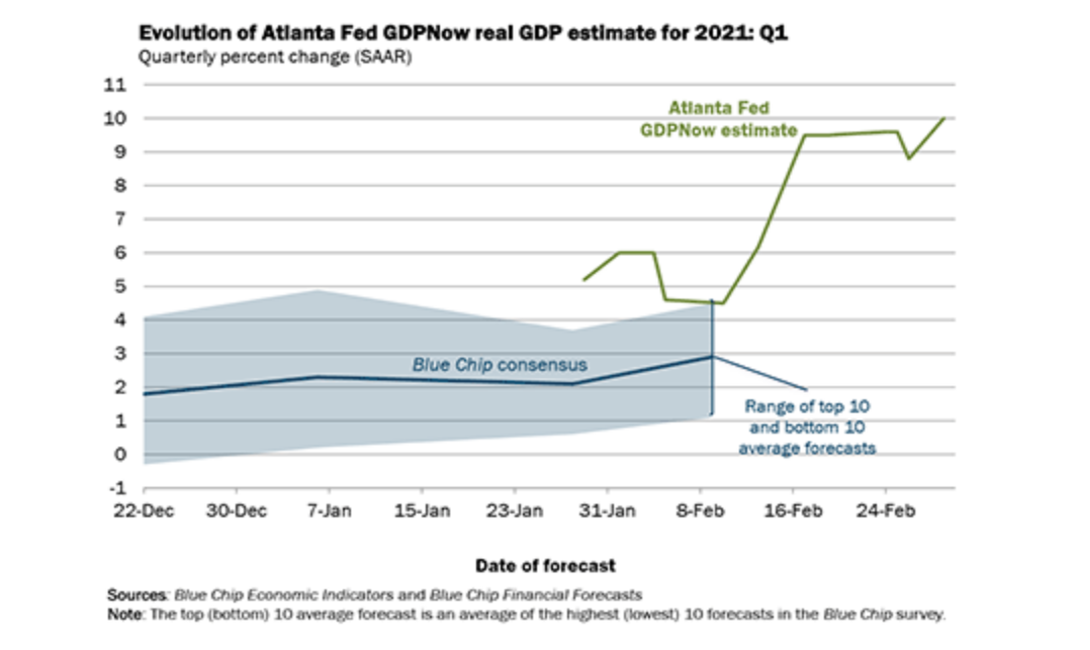
Considering the above chart, it is not difficult to justify positive YTD broad benchmark performance. Of further note is that second quarter earnings comparisons for many reporting companies should be enormously positive.
Reopening businesses are experiencing a surge of pent up consumer demand, which we noted in our last blog post. We expect this demand to support strong second half earnings growth in basic industry and manufacturing companies.
The upward bias in Treasury yields so far this year is significant and has sparked several equity selloffs over the past six weeks. Prices of the 10-year note, and the 30-year bond, have been persistently weak (increasing yields), but do yields at current levels portend a looming impediment to economic growth?
Fed Chairman Powell, since last spring, has been adamant that the Fed’s policy to provide ample liquidity to the economy and the bond markets remains unchanged and is likely to persist for at least another year.[3]
Budget deficit concerns generated by government revenue and spending imbalances plus bond purchases have been deemphasized. The Fed is focusing on its mandate to support full employment, triggering increasingly vocal inflation warnings in the financial press.
But is the economy teetering on the abyss of an inflationary spiral fueled by profligate spending and artificially low interest rates? Are there warning signs the Fed will be forced to modify its policy and begin tightening?
The below chart shows cumulative growth of the US Consumer Price Index (CPI) since 1926. The slope appears to suggest that inflation is problematic, but, in fact, the average annual increase is roughly 2.9%. Such is the effect of compounding.
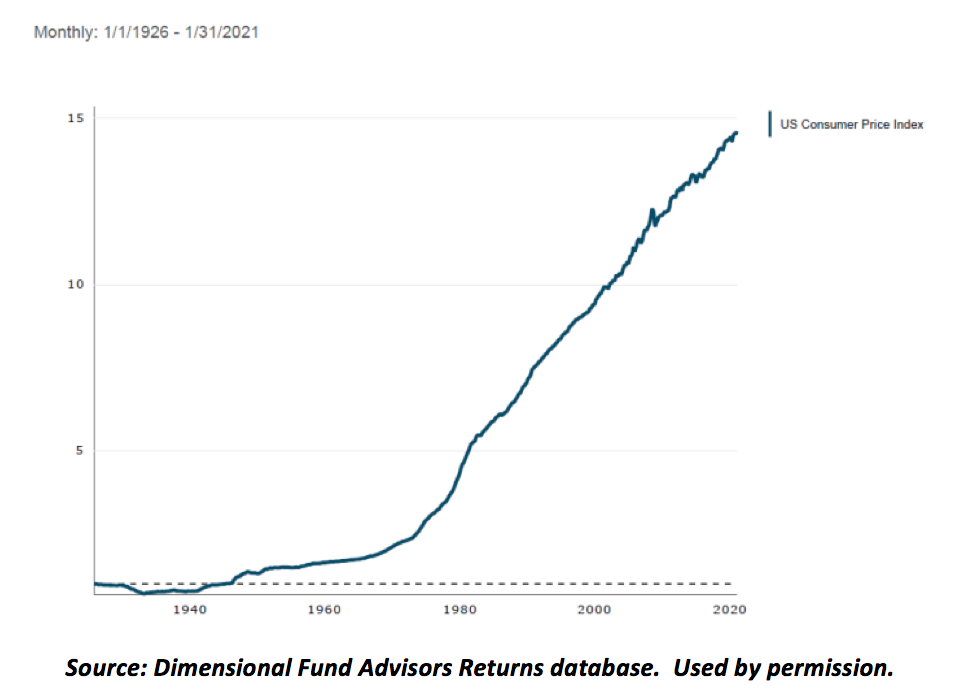
Note the steeper rate of increase from about 1970 after President Nixon halted dollar/gold convertibility. This decision allowed the Federal Reserve to fund Federal budget deficits in a boon to the US economy. Prior to the suspension, dollar creation had been limited by the value of government gold reserves.
We’re certainly not advocates of a return to the gold standard but present these data as evidence that inflation erodes purchasing power, in good and bad economic times. We’ll discuss an “antidote” to this involuntary loss later.
Currently, the 30-year US Treasury Bond yields approximately 2.3%, well under the past 105 years average annual rate of inflation. In other words, yields are not particularly out of line with the inflation rate.
As the economy continues its recovery and overall activity accelerates, we can naturally expect increases in borrowing costs. But until market expectations include less Federal Reserve bond buying, it is reasonable to expect that yields will not rise significantly further, absent investor demand for a greater inflation premium.
So, we know that inflation exists, will exist, and is closely correlated with the amount of money created and in circulation. We also know that manufacturing bottlenecks, supply shortages and unexpected demand can also exacerbate inflation, but for this discussion, we reiterate that presently, these are not significant contributing factors.
But how can investors protect their purchasing power from inflation’s inexorable impact?
Throughout the multiple decades we’ve observed markets, various vehicles have been advocated as effective hedges against inflation. Whether gold, collectibles, commodities, or bitcoin, etc., none has outperformed equity investments over time. Remember, “hedge” refers to a reduction of risk rather than a means of incremental return. If risk is reduced or eliminated, so is potential return. The fundamental equation, risk=reward, is a constant.
Fixed income yields can rise to levels that attract funds from equities because of bonds’ inherently lower risk. Presently, fixed income returns do not provide much competition for equities and given policy at the Federal Reserve, that relationship is unlikely to change in the foreseeable future.
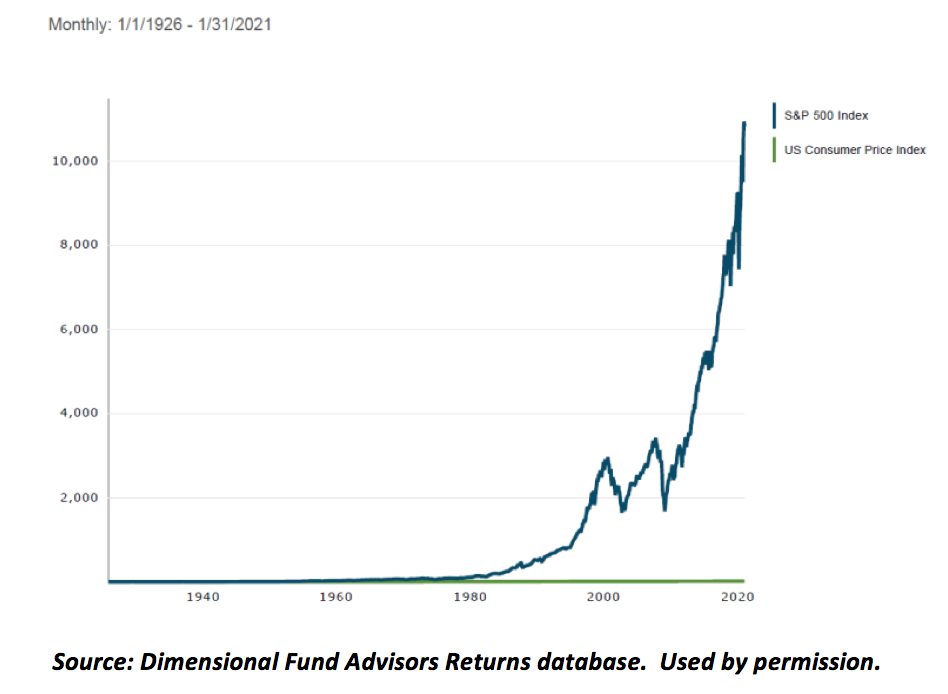
The below chart illustrates S&P 500 performance and CPI data since 1926. The S&P 500 registers average annual performance of 10.3%, a real rate over 7% (nominal return-inflation). This is the antidote to purchasing power decay.
Corrections in equity markets are as inevitable as the passage of time but investors that remain focused on a coherent strategy and philosophy have in hand the best means to outpace inflation and to harvest real returns. The pandemic is receding, allowing global economies to recover previous output levels and jobs. Short term volatility in stocks has historically led to long term gains. We find no reason to alter that conclusion.
Byron A. Sanders
Investment Strategist
[1] Facebook (NASDAQ-FB), Apple Computer (NASDAQ-AAPL), Amazon, Inc (NASDAQ-AMZN), Netflix, Inc. (NASDAQ-NFLX), Alphabet, Inc. (NASDAQ-GOOG). N.B.: Alphabet, Inc. is represented by its Google segment in the FAANG acronym.
[2] “Global Economic Outlook 2021: rebound will drive growth at record speed…,” www.prc.com, January 7, 2021.
[3] “Powell Confirms Fed to Maintain Easy-Money Policies,” www.wsj.com, March 4, 2021.